

NSW Department of Primary Industry
Primed for Growth Dashboards and Digital Infographic Design
THE CHALLENGE
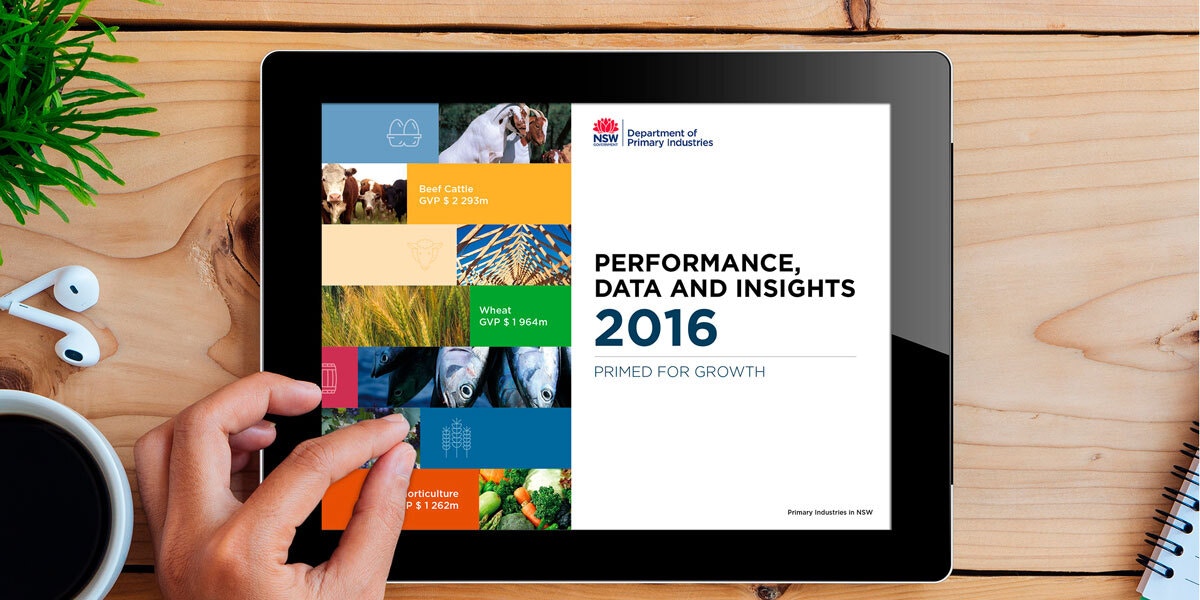
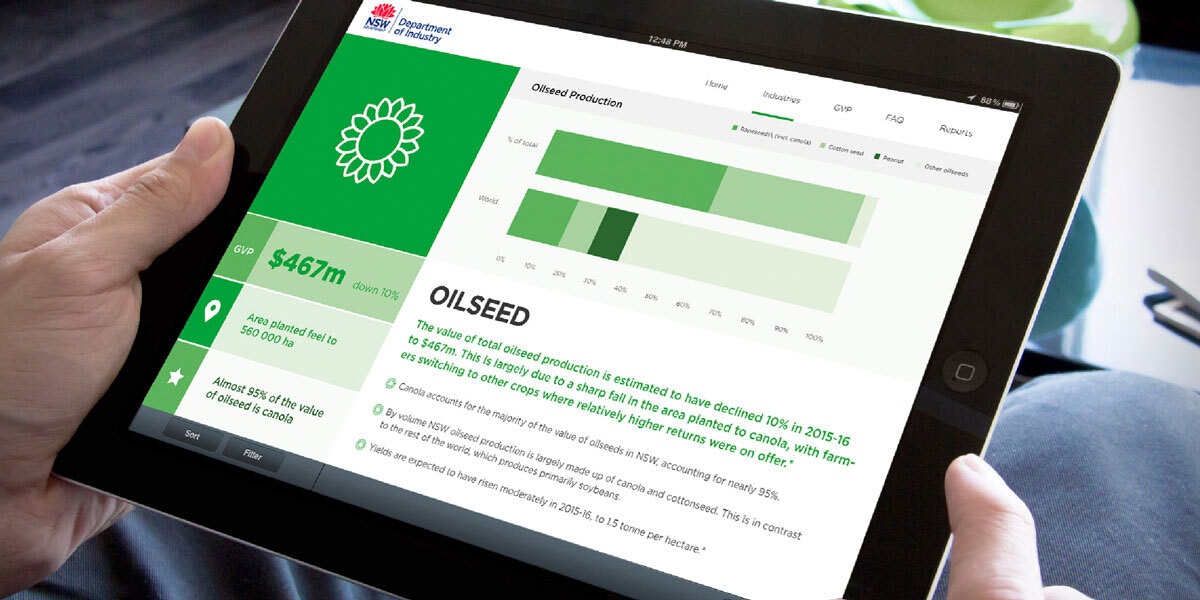
The Department of Primary Industry engaged Visual Metrics to design their annual report, showcasing New South Wales’ main primary industries. We were also contracted to investigate and present innovative new ways to communicate these results including infographics, microsites and an animated video series designed for social media.
OUR APPROACH
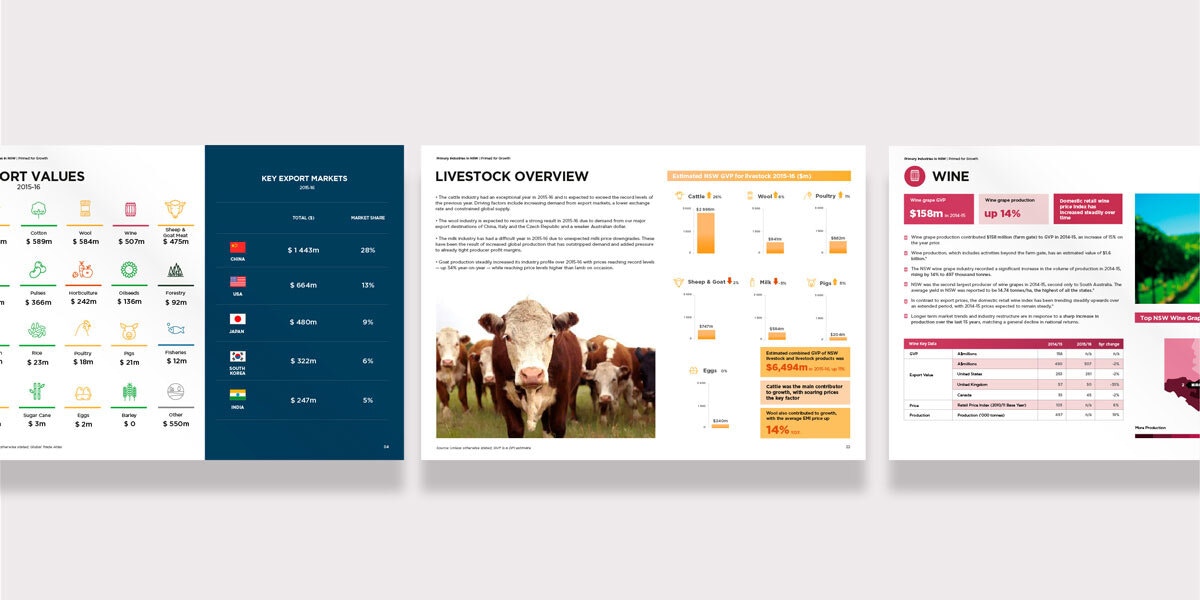
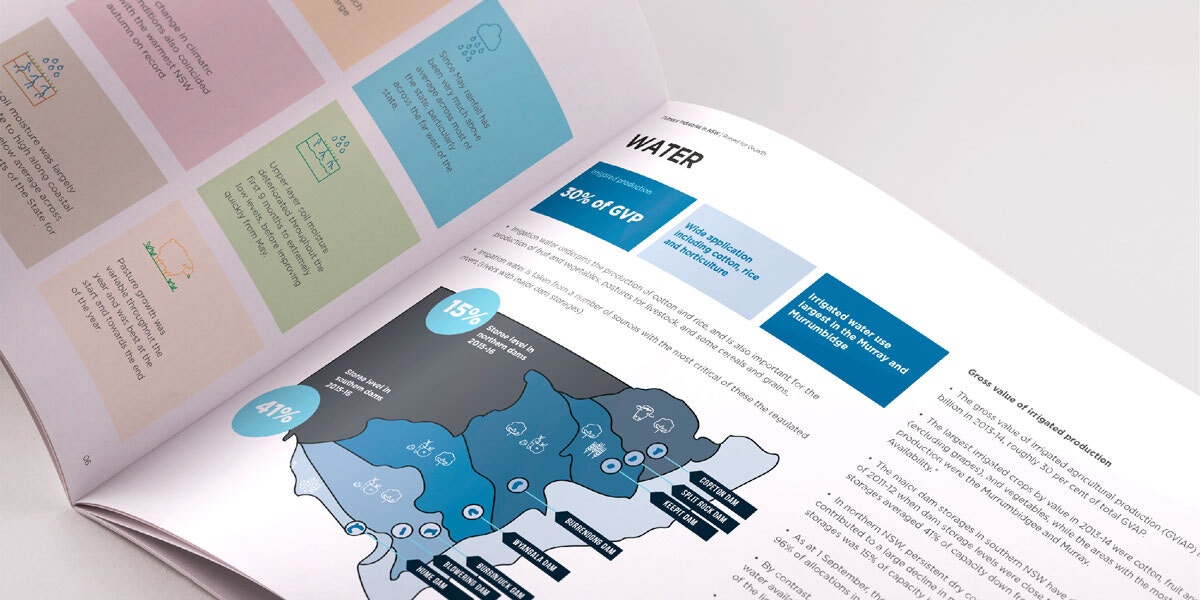
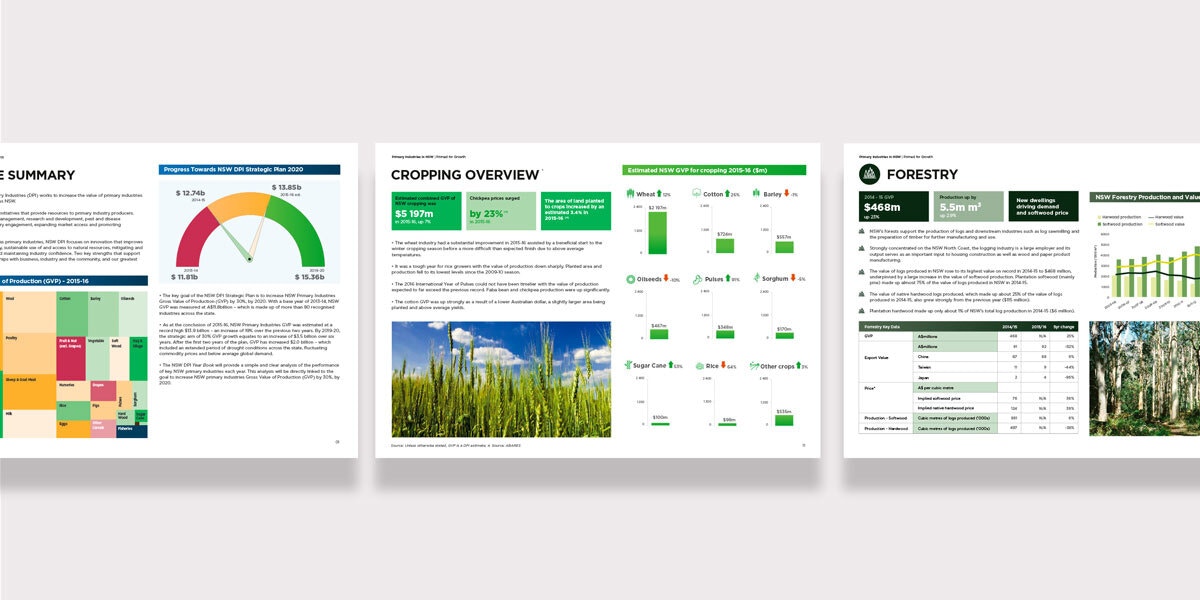
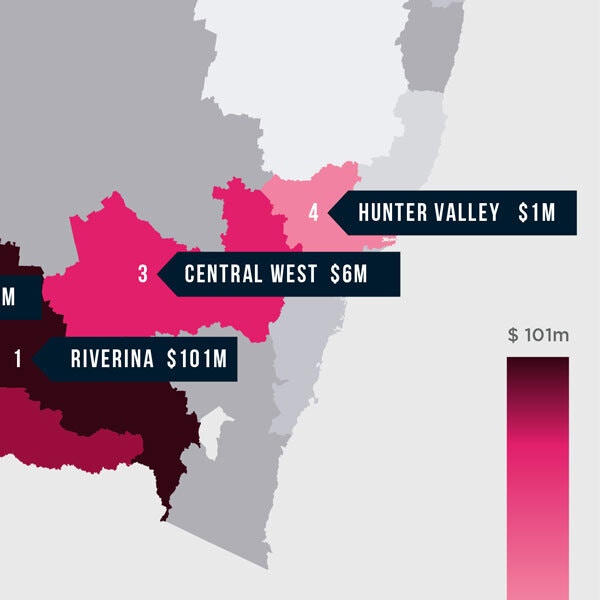
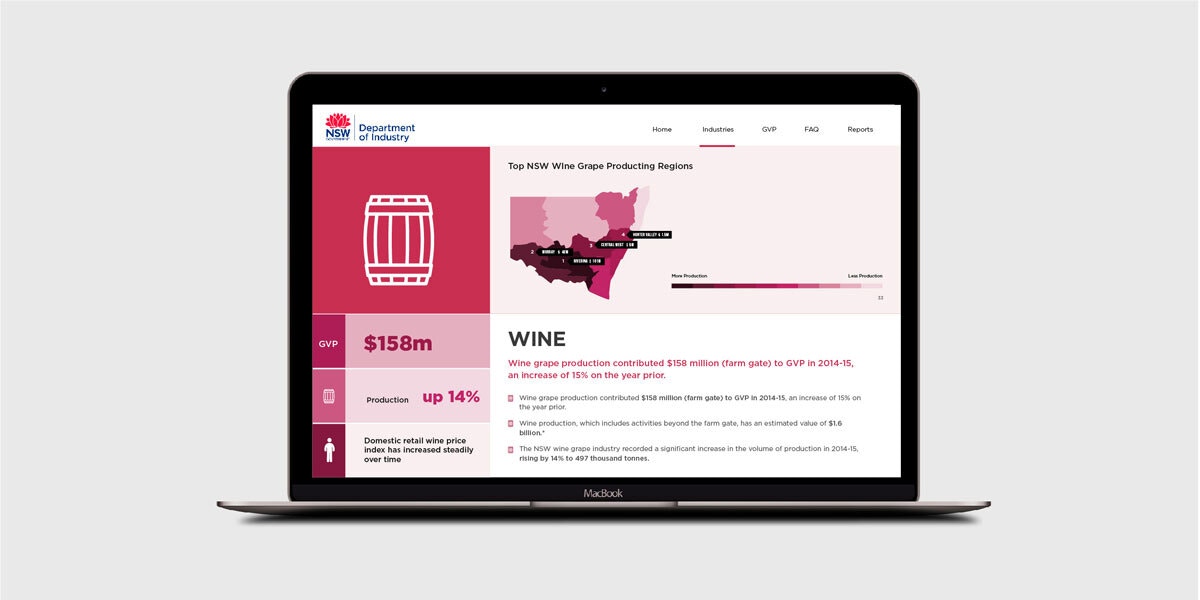
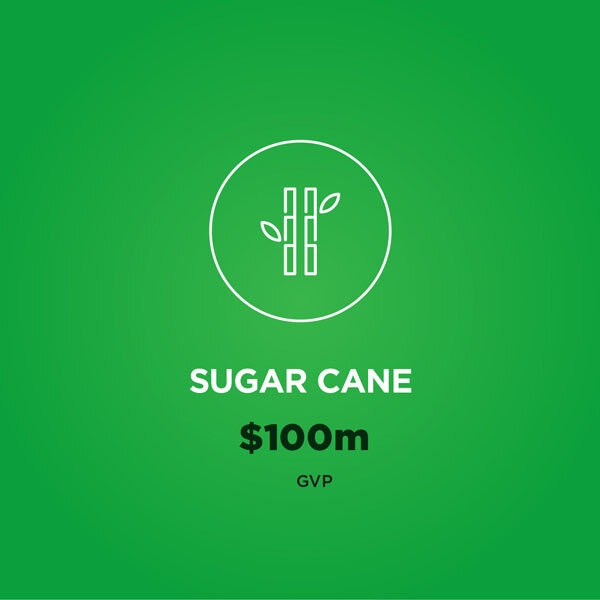
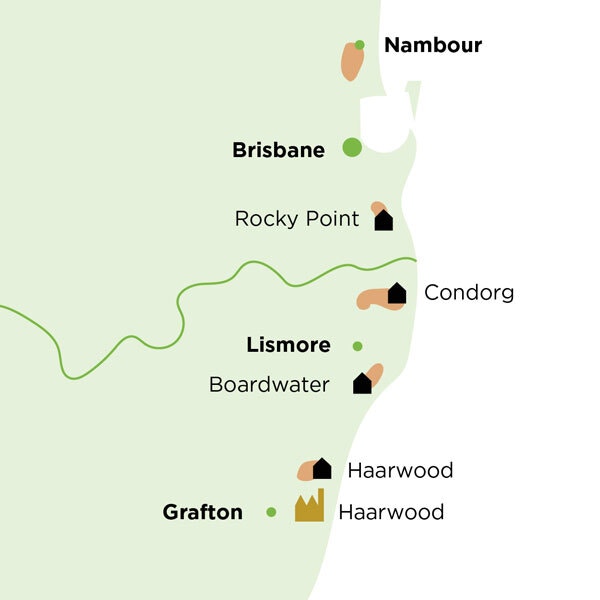
Due to extremely tight timelines, the size of the project and continuous content changes, a 24 hour rolling team was established for the duration of the project. We were able to use a full range of our skills in content and data visualisation, creating bespoke graphs and graphics for each of the primary industries. We conducted the design in a modular way, that could be built on and repurposed in the future by their internal teams.
THE RESULT
The project was delivered on time, within budget and was extremely well received by all stakeholders. We were able to set up a foundation for the automation of future reports, thereby allowing the NSW Department of Primary Industry to avoid doing any rework. We also proposed innovative new ways to communicate the departments data in the future.

Testimonial
Visual Metrics helped drive and deliver an innovative and different report to previous ones created by the Department of Primary Industry. Their advice on how to approach data visualisation has been invaluable and is helping set a course for exciting and innovative times ahead for us.
James Fisher, Director
