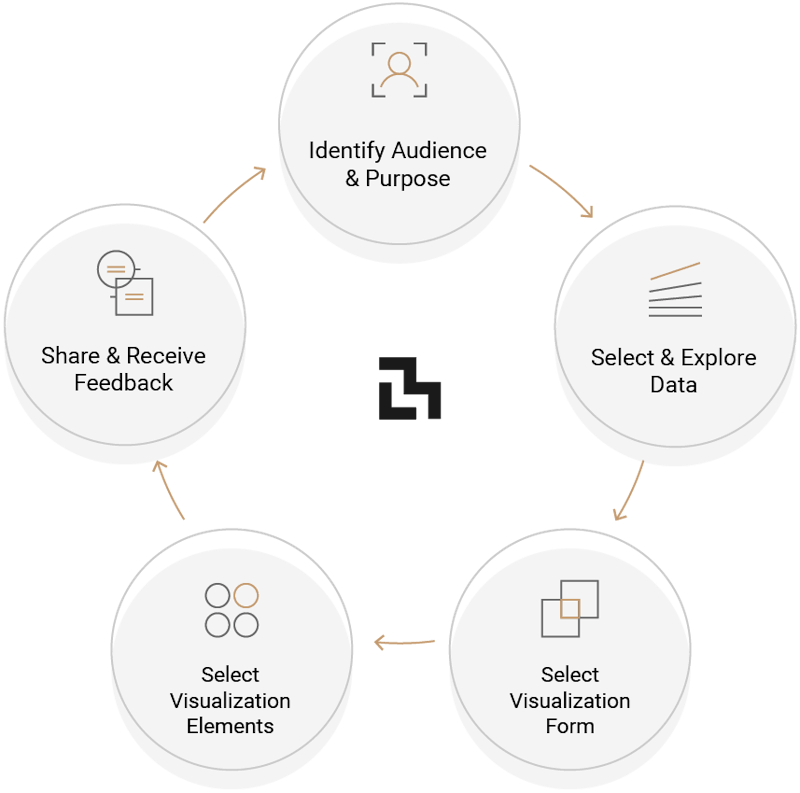
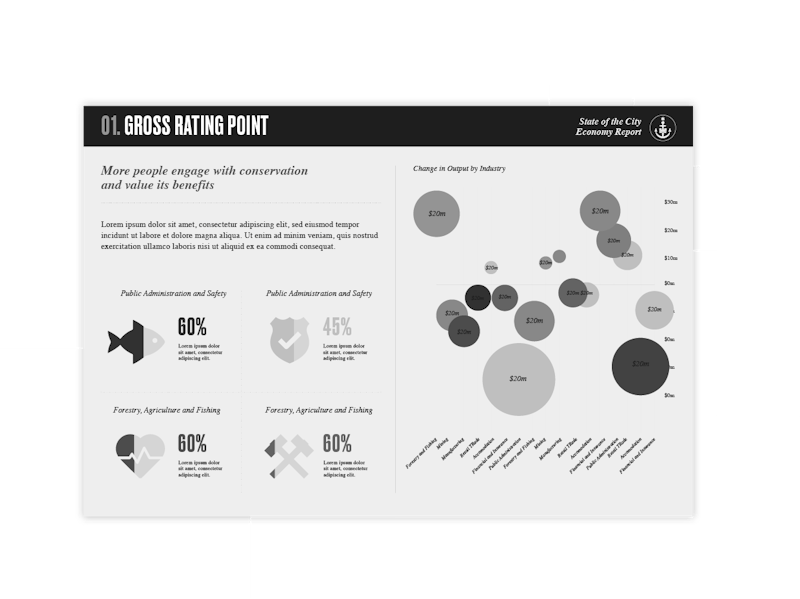
In a world of headlines and sound bites, clear and engaging graphics can make all the difference. Our team can break down the most tedious data sets to find the narrative and transform them into beautiful and straightforward infographics, data visualisations and immersive storytelling.

What Visual Metrics will do
We will use our knowledge of design and cutting edge technologies to deliver beautiful, memorable and clear content and experiences.
We will audit the data sources that are being captured and then we cleanse that data, using the best software to simplify, reformat, and rebuild it.
Together with your team, we will choose the best visualisation tools to influence your audience.
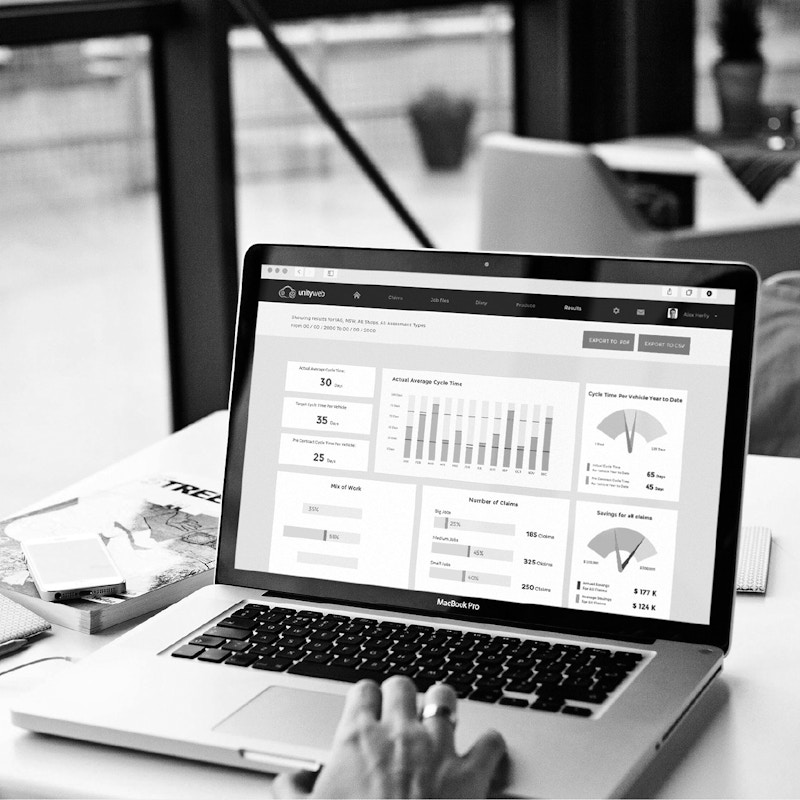
We will humanize those numbers through clean and beautiful data visualisation tools, like business intelligence dashboards, data presentations, animated data videos and infographic reports.
Your outcome
Your users will be free to focus on the understanding and exploration of what really matters. They will have human access to vital information for decision-making.
You will get visual stories that excite and influence your audience, users or teams.
Your audience will have a long-lasting and personalised impression encouraged by discovery.
You will become data-competent, being able to prove facts tangibly.


Clients often come to us in the need of
Infographics
Annual reports
Power point Design
Data Animation
Data Storytelling
Interactive Maps
Video
Dashboard Design
Survey Data Tools
Video & Data Analysis
Data Driven Dashboards
Data Visualisation Workshops
Infographic Workshops
Storytelling Workshops


